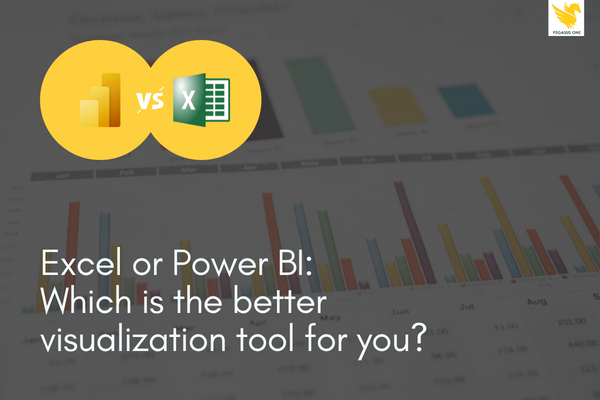
Excel vs. Power BI: Which is better for data visualization?
Are you processing large amounts of data with Excel? The data processing limitations of Excel may mean that you might not getting all the value you need from your data. If Excel isn’t getting the results you need, making a shift to a Power BI data solution can give you more robust data analysis in a fast, easy-to-use solution.
MS Excel: The bedrock of modern office
Let’s begin by looking at what Excel can and can’t do when it comes to data. Using a spreadsheet format, Excel organizes data into rows and columns. It performs calculations and executes mathematical formulas easily and quickly and can be used to transform data sets into visual information.
Excel’s limitations
Because of the way it was designed, Excel has a number of key limitations that may make it impractical for use for collaboration or with Big Data:
- Difficult to analyze unstructured and semi-structured data
- Dashboards show only static data and high-level trends
- Excel doesn’t update in real time
- Local storage with Excel is a security risk
- Customization options are limited
- Excel is primarily designed for individual-use worksheets
- Must be hosted in the cloud for version control
- No capacity for real-time collaboration
Power BI:
Power BI offers a three-part service: Power BI Desktop, Power BI Service (a SaaS product), and Power BI Mobile. Let look at how Power BI works with data.
Power BI connects a variety of data sources (including Excel) and provides a holistic dashboard of business intelligence for users. It can access both on-premises and cloud-based data storage, and refreshes in real time whenever cloud-based data is updated.
Advantages over Excel
Power BI has several important advantages over Excel when it comes to data. The most noticeable thing may be that Power BI offers measurably faster processing than Excel. It’s also more powerful than Excel in terms of delivering comparisons between tables, reports. or data files. From a user standpoint, Power BI is much more user friendly than Excel, and its interactive, customizable dashboards are much more visually appealing than those in Excel.
Power BI security features
Power BI also offers additional security features that Excel cannot match, including:
- Compliance support – Meet privacy and regulatory requirements with oversight of sensitive data through bring your own key (BYOK)
- Sensitivity labeling – Use Microsoft Information Protection in Microsoft 365 to apply sensitivity labels to Power BI data
- Data loss prevention – Extend data loss prevention and governance to Power BI users with Microsoft Cloud App Security
Have you outgrown your Excel data solution?
Need faster processing than Excel can provide? Got a large volume to data to process and visualize? Want to access and extract data from other systems and applications? If you answered ‘yes” to any of these questions, it may be time to consider a move from Excel to Power BI.
It might be time to make a move to Power BI if:
- you’re working with large-volume (more than 500 MB) datasets that your Excel solution can no longer support
- you need to collaborate without worries about version control
- you need to identify and act on data trends quickly
- you want to set email alerts to notify you of changes
- you want to publish and share dashboards and reports securely to the cloud
- you want to automate refreshes of underlying data
- you need Row-Level Security that can be set up without having to know how to code
- you want to be able to go beyond basic just graphs and charts when building data-visualizations
Read more: Migrating from Excel to Power BI – A pre-migration checklist.